Hough Transform is Feature extraction technique used to detect different mathematical shapes, including lines, circles, parabolas, ellipses and some irregular shapes.
Lets have few examples of hough transfom so you may understand it.
Hough Transform for lines
A line in the image space can be expressed with two variables in different systems i.e.Cartesian Coordinate system : y = mx + b -----(1)
Polar Coordinate system : r = x cos∅ + y sin∅ -----(2)
Now lets come to the theory,
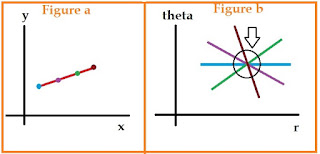
lets draw a line as shown in figure a in Cartesian coordinate system. This line contain four points.
- Let's take the first point(blue), find the values of x and y for this point. Put these values in polar coordinates equation (2).
- Draw a line in polar coordinates plane for the values of x and y and varying ∅, as shown in figure b (blue line).
- Repeat these steps for other three lines.
- Now if these points belong to a same line, they will meet a common point in polar coordinates. The more number of points the line have the more will be lines intersecting at the common points.
- The next step is to set a threshold. This threshold is imposed on the number of lines passing from the common point. This will set a min length of the line which are going to be detected.
 Is There any function for this in MATLAB ??
Yes, There is a function known as Houghlines(), Here is an example for you.
_________________________________________________________________________________
Example
img = imread('yourimage.jpg');
grayimg = rgb2gray(img);
edg = edge(grayimg,'canny'); % Edge detection is necessary before hough transform
imshow(edg)
[H,theta,rho] = hough(edg);
P = houghpeaks(H,5,'threshold',ceil(0.3*max(H(:))));
lines = houghlines(edg,theta,rho,P,'FillGap',5,'MinLength',7);
imshow(grayimg), hold on
max_len = 0;
for k = 1:length(lines)
xy = [lines(k).point1; lines(k).point2];
plot(xy(:,1),xy(:,2),'LineWidth',2,'Color','green');
% Plot beginnings and ends of lines
plot(xy(1,1),xy(1,2),'x','LineWidth',2,'Color','yellow');
plot(xy(2,1),xy(2,2),'x','LineWidth',2,'Color','red');
% Determine the endpoints of the longest line segment
len = norm(lines(k).point1 - lines(k).point2);
if ( len > max_len)
max_len = len;
xy_long = xy;
end
end
_________________________________________________________________________________
Hough Transform for cicles
Hough transform for circle is quite similar to that of line.Lets suppose we have a circle in cartesian plane with some radius r, as shown in figure below
- Now consider that there are 4 points on the circle. Draw new circles of same radius on these points as shown in the second figure in red color.
- You will see that these circles will intersect at a common point, which shows that these point belongs to the same circle.
- The next step is to set a threshold. This threshold is imposed on the number of circles passing from the common point. This will set a min points required for a shape to be declared as a circle.
 How can I do it in MATLAB ??
_________________________________________________________________________________
Example
img=imread('yourimage.jpg');
a=rgb2gray(img);
Rmin=2;
Rmax=25;
[centers,radii,metric]=imfindcircles(a,[Rmin,Rmax],'ObjectPolarity','dark','Sensitivity',0.895);
imshow(img);
viscircles(centers, radii,'LineStyle','--');
_________________________________________________________________________________


No comments:
Post a Comment
I FEEL AWESOME WHEN YOU COMMENT.